From Template
Superstore Dashboard
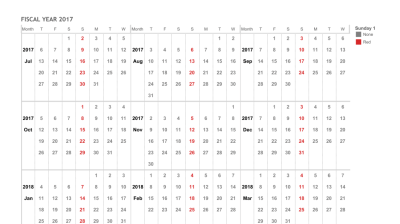
Interactive Fiscal Calendar
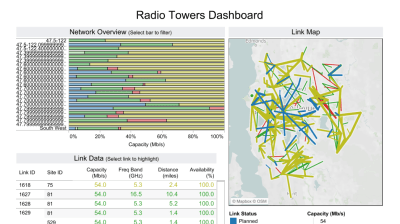
Telecommunications Analytics
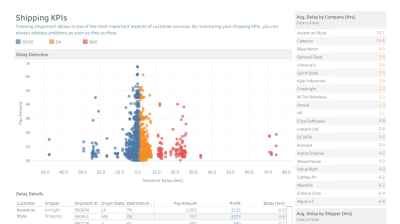
Profitability & Shipping KPIs
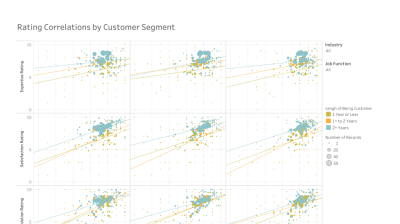
Customer Satisfaction
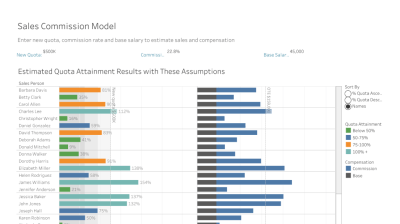
Sales Commission Model
 TABLEAU INSIGHTS
Trend
+12%
Revenue vs prior period
Sample - Superstore
West region drove 63% of the increase
Target Gap
-28%
Central region vs target
Sales Commission
Largest gap of any region, 6 weeks left in Q4
New Trend
+34%
New customer acquisition
Sample - Superstore
Technology segment leading with 52 new accounts
Unusually High
+18%
Shipping delays MoM
Sample - Superstore
Same-day ship mode most affected, avg 2.3 days late
Top Contributors
41%
Top 5 products share of profit
Sample - Superstore
Concentration increased from 33% last quarter
Trend
82%
Customer retention rate
CRM Dashboard
Steady with slight uptick in Consumer segment
New Trend
3.2x
Campaign ROI
Marketing Analytics
Q4 digital campaigns outperforming Q3 by 40%
Trend
$1.4M
Inventory cost savings
Supply Chain
JIT optimization reduced carrying costs 22%
Recents
Open a Workbook
Superstore Dashboard
Telecommunications Analytics
Customer Satisfaction
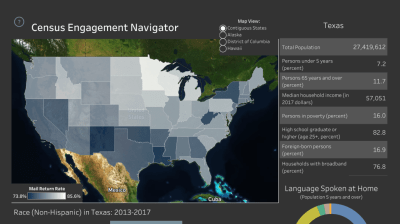
United States Census
Profitability & Shipping KPIs
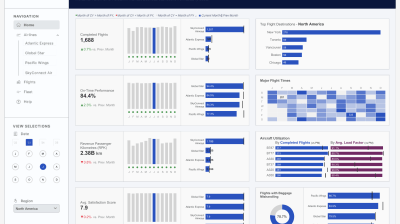
Alliance Overview
View More
Favorites
Interactive Fiscal Calendar
Sales Commission Model
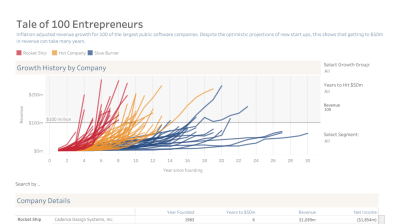
Tale of 100 Entrepreneurs
Superstore Dashboard
United States Census
Telecommunications Analytics
View More
 Recommended
Profitability & Shipping KPIs
Interactive Fiscal Calendar
Tale of 100 Entrepreneurs
Customer Satisfaction
Alliance Overview
Sales Commission Model
View More
 Quickstart
Templates
Jumpstart your analysis with pre-built Accelerators
Sales Cloud Analysis
Executive Summary
Segmentation & Customer Insights
East Sales Region Quarterly Report
Samples
Explore what Tableau can do!
Tableau 101
Super Store
World Indicators
 Insights

‹
Sales Commission
Sales Target
Sample - Superstore
Sales Target
Sample - Superstore
Tables
Category
Order Date
Segment
Measure Names
Sales Target
Sales Target (Count)
Measure Values
Parameters
Base Salary
Churn Rate
Commission Rate
New Business Growth
New Quota
Sort by
Pages
Filters
Marks
Columns
Rows
Sheet 1
Insights
Trend
+12%
Revenue vs prior period
Sample - Superstore
West region drove 63% of the increase
Target Gap
-28%
Central region vs target
Sales Commission
Largest gap of any region, 6 weeks left in Q4
New Trend
+34%
New customer acquisition
Sample - Superstore
Technology segment leading with 52 new accounts
Unusually High
+18%
Shipping delays MoM
Sample - Superstore
Same-day ship mode most affected, avg 2.3 days late
Top Contributors
41%
Top 5 products share of profit
Sample - Superstore
Concentration increased from 33% last quarter
Trend
82%
Customer retention rate
CRM Dashboard
Steady with slight uptick in Consumer segment
Suggested
Monthly sales forecast for next quarter
Profit distribution across sub-categories
Customer acquisition cohort analysis
Geographic heat map of sales by state
Discount impact on profit margins
Order volume by day of week and ship mode